National Foundation Study Shows Improved 2016 Investment Returns; Spending Rate Steady to Higher
Data from the Council on Foundations-Commonfund Study Position Private and Community Foundations for Future Mission Support
Data gathered in the 2016 Council on Foundations–Commonfund Study of Investment of Endowments for Private and Community Foundations® (CCSF) show that participating private foundations reported an average return of 6.4 percent for the 2016 fiscal year (January 1 – December 31, 2016) while participating community foundations reported an average return of 7.3 percent for the same period. (All return data are reported net of fees.)
Both returns were higher than those reported for FY2014 and FY2015. For the 2015 fiscal year, private foundations reported an average return of 0.0 percent, while participating community foundations reported a -1.8 percent average return. Comparable returns for 2014 were 6.1 percent and 4.8 percent, respectively.
The effective spending rate in FY2016 rose to 5.8 percent among participating private foundations, up from 5.4 percent the previous year, while the effective spending rate for community foundations declined slightly to 4.7 percent from 4.8 percent in FY2015.
“Investment returns for 2016 are encouraging, but deliver a mixed message: It is heartening to see improved investment performance, especially given its implications for ongoing mission support. But with trailing 10-year returns averaging 4.7 percent for participating private foundations and 4.6 percent for community foundations, long-term returns are not sufficient to maintain the corpus of foundations’ endowments after spending, inflation and costs,” said the President and CEO of the Council on Foundations Vikki Spruill and Executive Director of Commonfund Institute William F. Jarvis in a joint statement. “Over the past 10 years, community foundations’ returns roughly equal their 2016 effective annual spending rate, but do not offset the effect of inflation and costs. Private foundations’ 10-year investment returns are 110 basis points lower than their 2016 effective spending rate, and, if continued, this could be a concern over the long term.”
With 203 participating foundations representing combined assets of $96.3 billion, the Study is believed to be the most comprehensive annual survey of its kind. This is the fifth year that Commonfund Institute and the Council on Foundations – two leading organizations in the field of foundation investment and governance policies and practices – have partnered to produce this research.
FY2016 INVESTMENT RETURNS TOP THE TRAILING 10-YEAR AVERAGE
Returns Ahead of 3-Year Average, Mixed for Trailing 5 Years
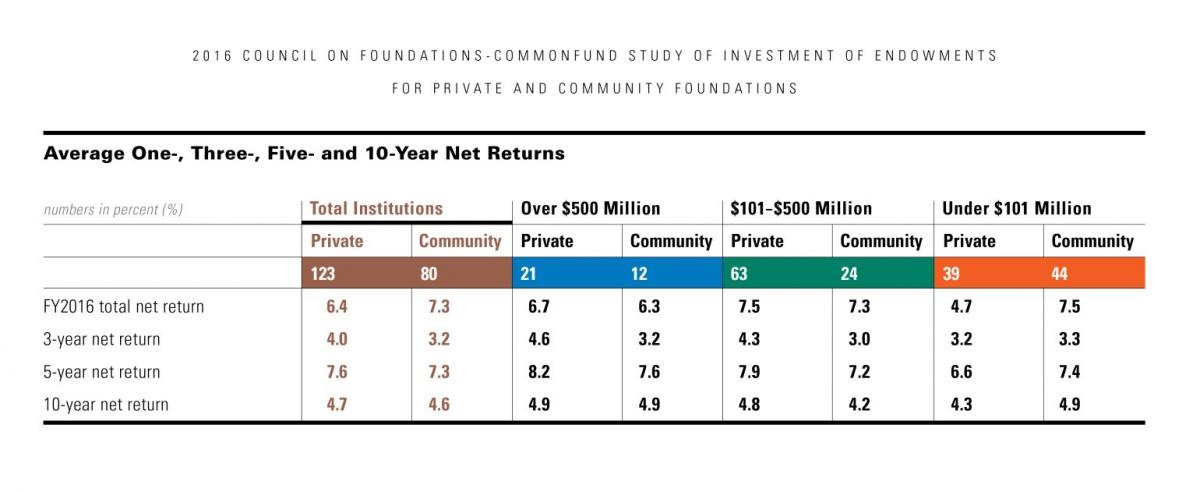
As noted, FY2016 returns were the highest in three years for both private and community foundations. Given the lower returns realized in FY2014 and FY2015, FY2016 returns were higher than the three-year trailing average for foundations of both types. Compared with the trailing five years, private foundations’ FY2016 returns lagged by 120 basis points, while community foundations’ return equaled its five-year average. Returns for 2016 were ahead of trailing 10-year returns for foundations of both types—by 170 basis points for private foundations and 270 basis points for community foundations.
Return data by asset class show that U.S. equities generated the highest return for foundations of both types, followed by short-term securities/cash/other, alternative strategies, non-U.S. equities and fixed income.
| Private Foundations | Community Foundations | |||
| FY2016 | FY2015 | FY2016 | FY2015 | |
| U.S. equities | 11.8% | -0.8% | 12.4% | -0.7% |
| Fixed income | 3.8 | -0.3 | 3.7 | -0.7 |
| Non-U.S. equities | 4.8 | -4.5 | 4.1 | -5.1 |
| Alternative strategies | 5.6 | -2.2 | 5.1 | -2.1 |
| Short-term securities/cash | 0.8 | 0.0 | 0.3 | 0.0 |
Investment Performance Varied by Foundation Type
Community foundations generally realized higher investment returns in FY2016—7.3 percent on average versus 6.4 percent for private foundations. This is a reversal of the last three years’ returns, when private foundations secured the higher returns. The FY2016 outperformance by community foundations may be attributed in part to their larger allocation to U.S. equities, the best-performing asset class in FY2016. In addition, community foundations’ allocation to this asset class generated slightly better returns than that of private foundations. In particular, U.S. equities posted strong gains in the last two months of the year following Donald Trump’s election to the presidency. Private foundations reported larger allocations to alternative strategies, which may also benefit should the economy strengthen.
When FY2016 CCSF data are analyzed by both size and type of participating foundation, private foundations produced the higher average annual return across the two larger size categories, but trailed by 280 basis points (4.7 percent to 7.5 percent) among foundations with assets under $101 million. In the case of foundations with assets over $500 million and those with assets between $101 and $500 million, private foundations realized higher FY2016 returns by 40 and 20 basis points, respectively. The same return pattern held for trailing three- and five-year periods, as private foundations in the two larger size cohorts realized higher returns than their community foundation counterparts, while the latter reported higher returns among smaller foundations.
Over the trailing 10 years, private and community foundations with assets over $500 million both reported returns averaging 4.9 percent. Over the same time period, private foundations with assets between $101 and $500 million realized an average annual return of 4.8 percent versus community foundations’ 4.2 percent. Among foundations with assets under $101 million, community foundations realized an average annual return of 4.9 percent compared with 4.3 percent for private foundations.
PRIVATE FOUNDATIONS’ SPENDING ON MISSION HIGHER IN FY2016
Mission Spending
As noted, the effective spending rate in FY2016 rose to 5.8 percent among participating private foundations, compared with 5.4 percent the previous year, while the effective spending rate for community foundations declined slightly to 4.7 percent from 4.8 percent in FY2015. Spending in dollar terms was mixed. Sixty percent of private foundations with assets over $500 million reported an increase spending dollars, up from 50 percent last year; 42 percent of community foundations in the same size category increased spending dollars compared with 50 percent a year ago. Spending in dollar terms declined for private foundations in the other two size categories, rose for community foundations in the $101 to $500 million cohort and was unchanged for those community foundations with assets under $101 million, year over year.
Foundation Fiduciaries Adapting to a Lower Return Environment
Foundation fiduciaries appear to be adapting to the potential for a lower return environment by moderating their long-term return expectations. The average long-term investment objective among private foundations with assets over $500 million fell to 6.9 percent from 7.7 percent in FY2015, while among similarly sized community foundations it remained steady at 7.1 percent.
Among private foundations within the same size category, none had a long-term return objective of 9.0 percent or more in FY2016 compared with 8 percent a year ago and 16 percent in FY2014. In addition, no community foundation in that size cohort reported an objective of 9.0 percent or more this year nor in Studies for FY2015 and FY2014. The proportion of foundations with long-term return objectives of 9.0 percent or more in FY2016 declined among private foundations in the remaining two size categories, while it rose modestly for community foundations in those size cohorts.
DATA BY ASSET CLASS
Investment Returns
Last year, return data were negative or zero for each of the major asset classes included in the Study. This year, all were positive, led by U.S. equities at 11.8 percent for private foundations and 12.4 percent for community foundations. Alternative strategies returned 5.6 percent for private foundations and 5.1 percent for community foundations. Non-U.S. equities returned 4.8 percent for private foundations and 4.1 percent for community foundations. Fixed income generated a 3.8 percent return for private foundations, 3.7 percent for community foundations. Short-term securities/cash returned 0.8 percent and 0.3 percent for private foundations and community foundations, respectively.
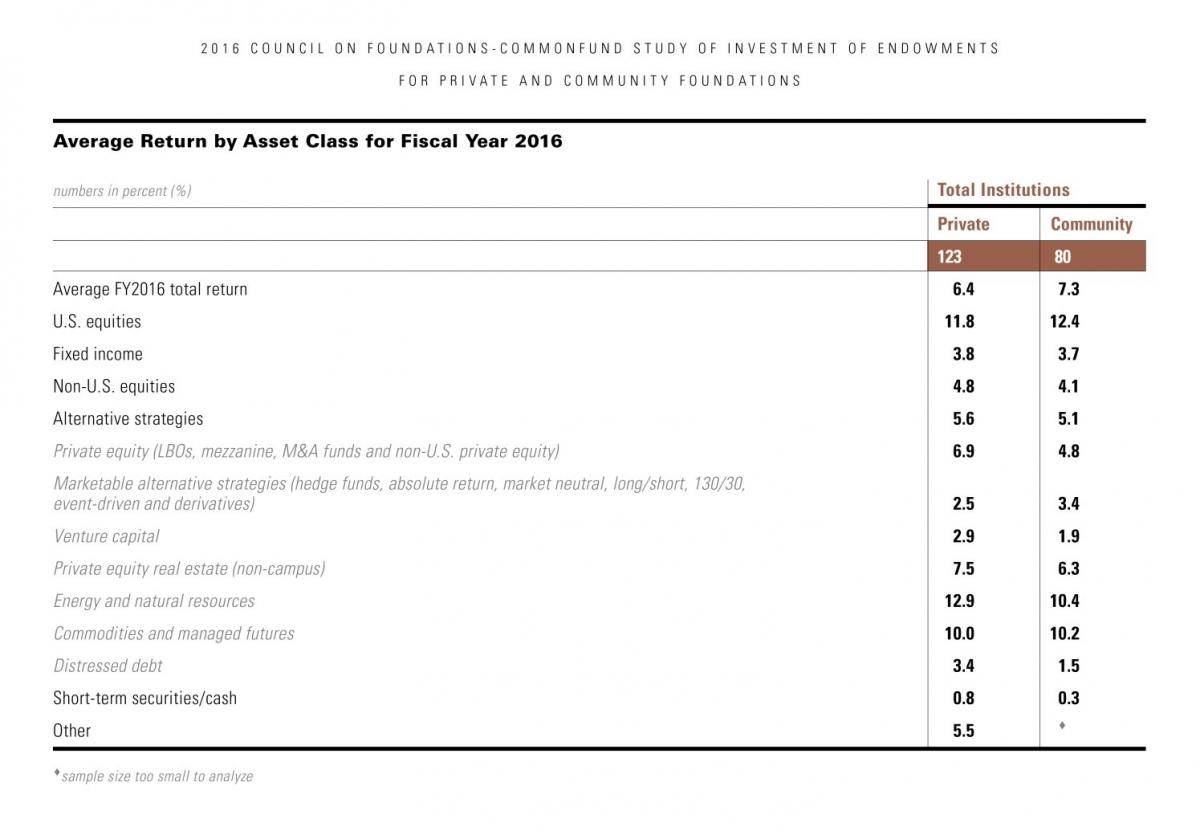
Within the broad category of alternative assets, the strongest return came from energy and natural resources, at 12.9 percent for private foundations and 10.4 percent for community foundations. This was a dramatic turnaround from last year’s -13.3 percent for private foundations and -7.5 percent for community foundations. The commodities and managed futures turnaround was also quite dramatic, as this year it returned 10.0 percent for private foundations, up from -22.5 percent in FY2015. (Last year, too few community foundations reported on this allocation for it to be statistically reliable.) Generally, foundations’ largest alternatives allocation, marketable alternative strategies (hedge funds, absolute return, market neutral, long/short, 130/30, event-driven and derivatives) swung from negative last year to positive this year, returning 2.5 percent for private foundations and 3.4 percent for community foundations. Private equity (LBOs, mezzanine, M&A funds and non-U.S. private equity) returned 6.9 percent among private foundations and 4.8 percent among their community counterparts. Last year’s leader, venture capital, produced lower returns this year, at 2.9 percent for private foundations and 1.9 percent for community foundations. The return on private equity real estate (non-campus) was also lower, at 7.5 percent for private foundations and 6.3 percent for community foundations. Finally, distressed debt returned 3.4 percent for private foundations and 1.5 percent for community foundations.
Asset Allocation
As of December 31, 2016, participating institutions’ asset allocations, and their comparable FY2015 allocations, were:
| Private Foundations | Community Foundations | |||
| FY2016 | FY2015 | FY2016 | FY2015 | |
| U.S. equities | 24% | 24% | 33% | 33% |
| Fixed income | 8 | 9 | 14 | 16 |
| Non-U.S. equities | 19 | 18 | 22 | 22 |
| Alternative strategies | 45 | 45 | 25 | 25 |
| Short-term securities/cash | 4 | 4 | 6 | 4 |
In a relatively low volatility market environment, asset allocations for both types of foundation remained remarkably stable from year to year, with virtually no change at the level of the five major allocation categories.
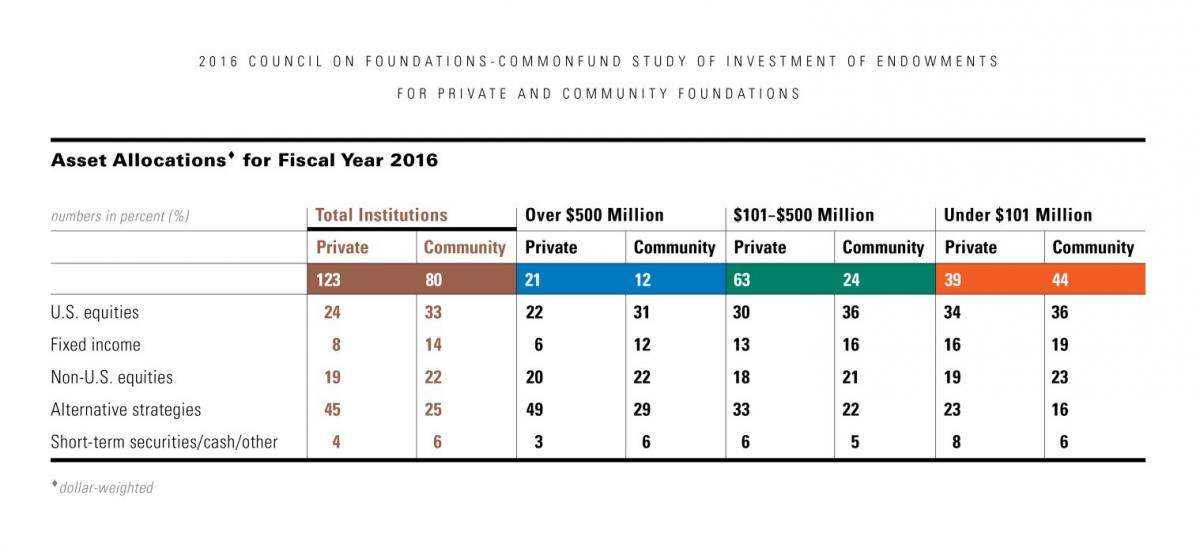
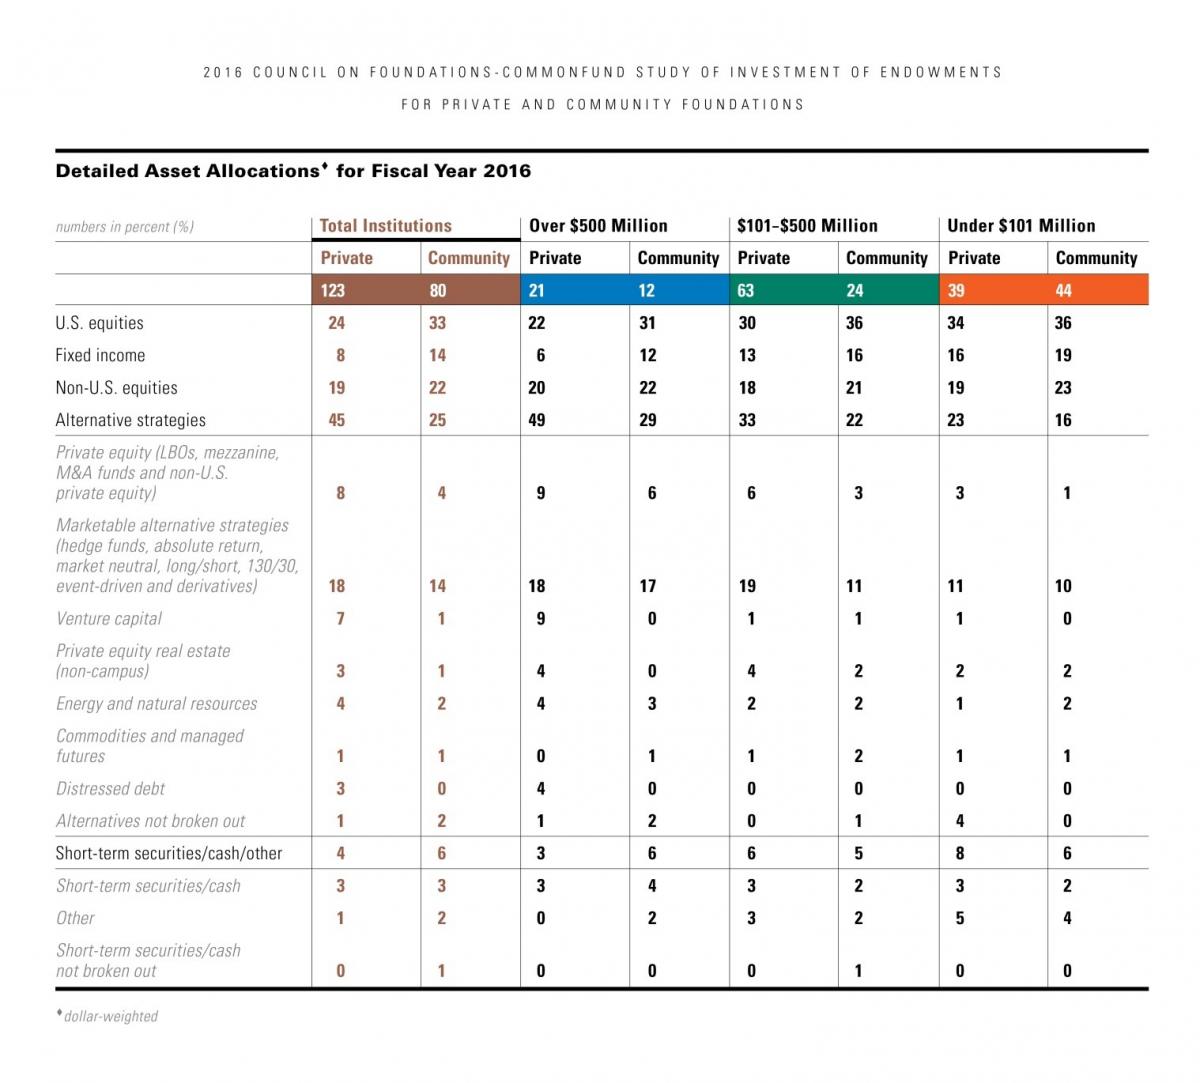
Among alternative strategies, only marketable alternative strategies showed any consistent change in allocation as this category rose for foundations of both types across all size categories, except for private foundations with assets under $101 million, where it dropped to 11 percent in FY2016 from 12 percent the year before.
RESEARCH PROCESS AND METHODOLOGY
The 2016 CCSF is the fifth annual report produced jointly by the Council on Foundations and Commonfund Institute. The Study segments participating private and community foundations by size into the following categories:
- Foundations with endowment assets over $500 million
- Those with endowment assets between $101 and $500 million
- Those with endowment assets under $101 million
The design of the 2016 Council on Foundations – Commonfund Study of Investment of Endowments for Private and Community Foundations (CCSF) took place in the winter of 2016. Web-enabled questionnaires and field interviews with the participating institutions followed in the first and second calendar quarters of 2017.
Online survey responses were supported by extensive telephone contact, a research technique that assures greater integrity in the data gathering process. Respondents were the individuals most knowledgeable about investment matters at participating institutions.
Data from the Study’s research population were segmented by private foundations and community foundations to permit analysis of the policies and practices of these two differing foundation types. Data were also segmented into three size categories to compare and contrast the policies and practices of foundations of differing sizes as well as the investment results they produce, where applicable. As noted, the size categories were: institutions with endowment assets over $500 million; institutions with endowment assets between $101 and $500 million; and institutions with endowment assets under $101 million.
The Study gathered data from 203 private and community foundations, with 123 private foundations and 80 community foundations participating.
The fifth annual CCSF will be made available to all participating foundations. The report will also include a comprehensive written analysis setting the data in the context of the FY2016 financial environment and trends that shaped financial markets during the year.
###
About the Council on Foundations
An active philanthropic network, the Council on Foundations (www.cof.org), founded in 1949, is a nonprofit leadership association of grantmaking foundations and corporations. It provides the opportunity, leadership, and tools needed by philanthropic organizations to expand, enhance, and sustain their ability to advance the common good. With members from all foundation types and sizes, the Council empowers professionals in philanthropy to meet today’s toughest challenges and advances a culture of charitable giving in the U.S. and globally.
About Commonfund
Commonfund was founded in 1971 as an independent asset management firm focused on not-for-profit institutions. Today, we are one of North America’s leading investment firms, managing $24 billion in assets for some 1,400 institutional clients, including educational endowments, foundations and philanthropic organizations, hospitals and healthcare organizations and pension plans. Our only business is investment management, and we are active in all sectors of the global capital markets, both public and private.
About Commonfund Institute
Commonfund Institute houses the education and research activities of Commonfund and provides the entire community of long-term investors with investment information and professional development programs. Commonfund Institute is dedicated to the advancement of investment knowledge and the promotion of best practices in financial management. In addition to teaming with the Council on Foundations to produce the CCSF, Commonfund also produces the NACUBO-Commonfund Study of Endowments® (NCSE) and the Commonfund Benchmarks Study® series of research reports. Commonfund Institute also provides a wide variety of resources, including conferences, seminars and roundtables on topics such as endowments and treasury management; proprietary and third-party research and publications, including the Commonfund Higher Education Price Index® (HEPI); and events such as the Endowment Institute® and the annual Commonfund Forum.